Featured Content

AI Agent Skills: Stop Paying for Tokens You Don't Need
AI agent Skills replace bloated instruction files with on-demand context loading — cutting token waste by 80% for Excel and Power Query workflows.
AI Agent Skills: Stop Paying for Tokens You Don't Need
AI agent Skills replace bloated instruction files with on-demand context loading — cutting token waste by 80% for Excel and Power Query workflows.

KPI Tree for Performance Management: A Visual 7-Step Guide
KPI Tree for Performance Management: a practical 7-step method to align strategy with KPIs, cut metric overload, and create dashboards people actually use.

Why Your BI Team Needs a Product Mindset, Not Just Reports
Discover why developing a BI team product mindset is essential for building compounding value. Learn how to shift from reactive reporting to strategic product thinking.

DAX and UDF SVG Charts in Power BI: Complete Guide
Learn to build DAX and UDF SVG charts in Power BI with this complete guide. Create custom visualizations using pure DAX code with dynamic scaling and conditional formatting.

DAX + UDF = the React of Power BI
Learn how to combine Power BI DAX user-defined functions with HTML visuals to build reusable KPI cards, tables, and progress bars that wow report stakeholders.

Automating Power BI Themes with Fabric, Notebooks and BIBB Theme Generator API: A Complete Guide
Learn how to automate Power BI report theme updates using Microsoft Fabric, Python, and the BIBB Theme Generator API for seamless theme management.

What is a Template in Power BI? Settling the debate.
Understand what each Power BI Template type does, when to use it, and how it shapes the user experience.

Improving BI User Experience in Corporate Environments: Practical Strategies That Work
Discover actionable techniques for improving BI user experience in corporate environments, focusing on user personas, training, and documentation.

Data Exfiltration in Power Query - Understanding the Risk and Protections
Data Exfiltration in Power Query: Understanding the Risk and Protections

Automation of the 'Meet the Team' PDF Slides with Power BI
Automate 'Meet the Team' PDF slides using Power BI, SharePoint, and Power Automate to save time, ensure consistency, and scale across proposals.
Master Power BI Time Comparisons and Top N Analysis for Optimal Performance

The Use Case
There was a requirement from my client that seemed simple at first but turned out to be a Trojan horse after deeper investigation. The goal was to create a Power BI Time Comparisons Top N Analysis page, giving users complete control over the Top/Bottom N products based on multiple metrics. Users needed to define the period, compare it with other periods, and adjust the N parameter dynamically.
 Interactive Power BI Time Comparisons and Top N Analysis dashboard
This can be achieved in two ways:
- Using measures, field parameters, and a large SWITCH measure. The downside? Performance—this method can be as slow as a turtle.
- Using field parameters combined with calculation groups. The result? Performance as fast as a Ferrari 488 Spider!
Hint: To ensure the best performance in Power BI Time Comparisons Top N Analysis, I avoid functions like RANKX, IF, and SWITCH, as they negatively impact speed. Keep reading to discover better alternatives!
The Solution
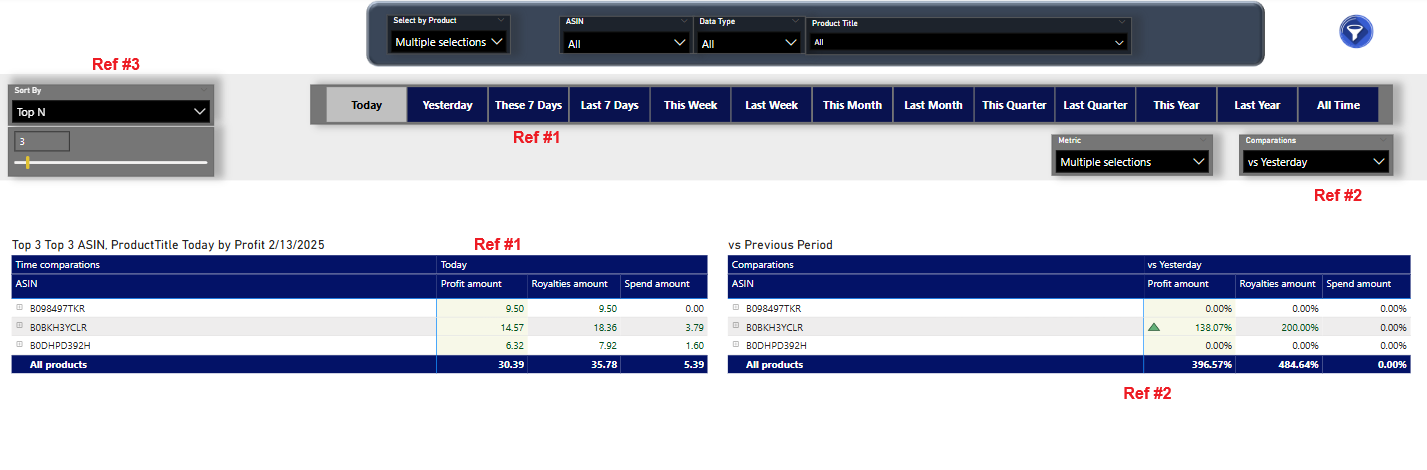 Refer to this image to understand each part
First, we create the metrics we want to visualize; in my case, Profit amount will be the base measure and primary metric:
Profit amount = CALCULATE(
    SUMX(
        FactData,
        FactData[Profit]
    )
)
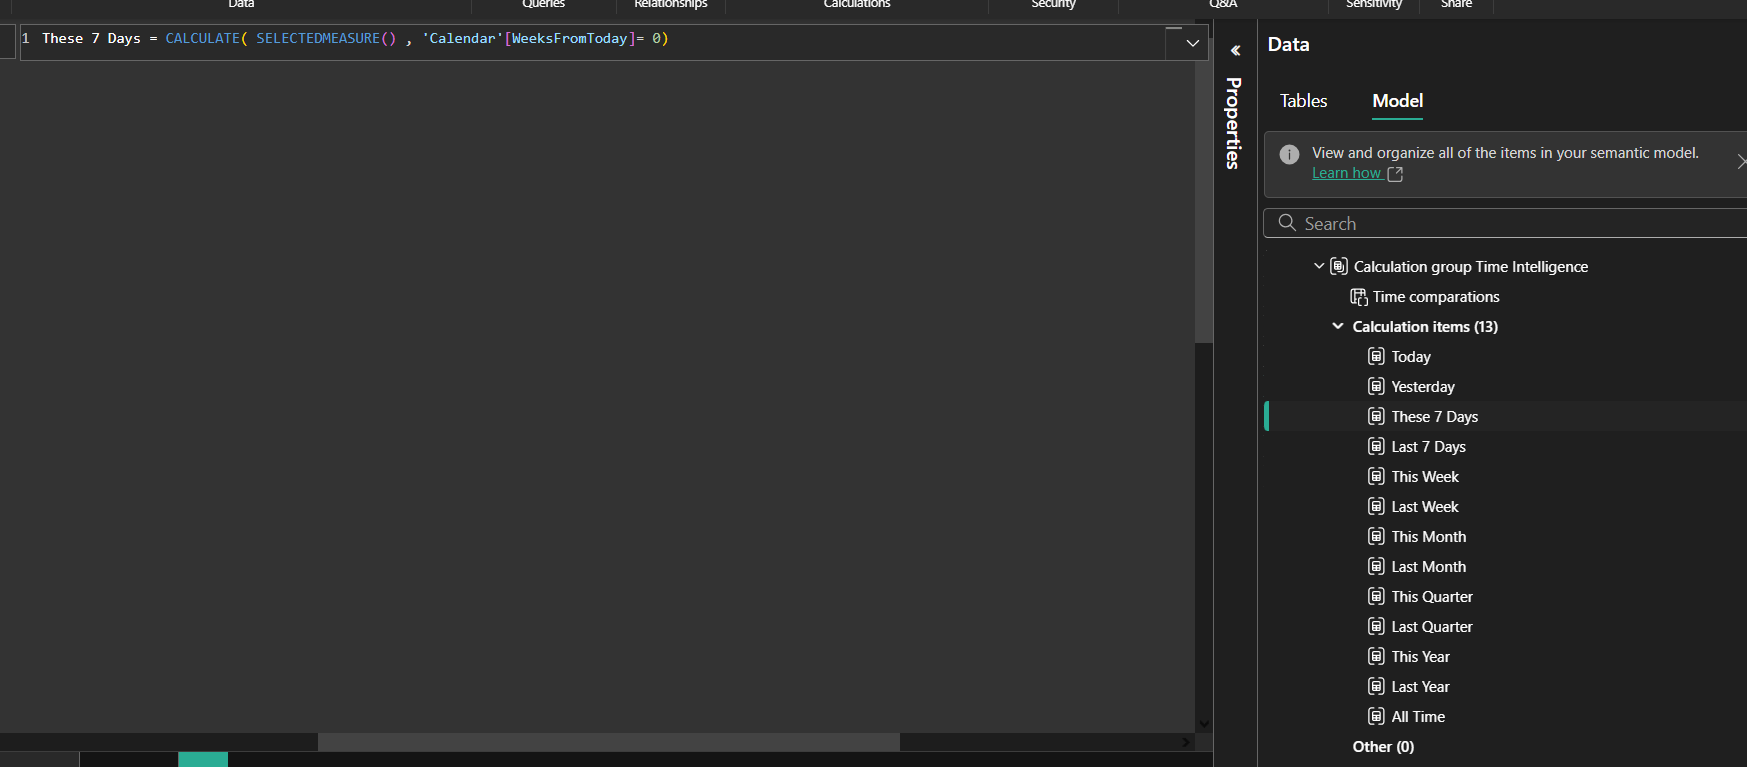
Part 1 - Time Intelligence Measures - REF #1
We create a calculation group for the time periods that will calculate the Profit amount for each period.
-
Create a new calculation group.
-
In Calculation items, create the measures you need for time intelligence. You can use whatever method like time intelligence functions; in my case, I am using precalculated week index that marks the current week as 0, the weeks before as negative numbers, and the weeks after as positive numbers:
 Shoutout to my friend Andrew for teaching me this simple method to have time intelligence measures.
- Place the Profit amount measure in the matrix as Rows, the calculation group in the matrix columns, and in a slicer, too.
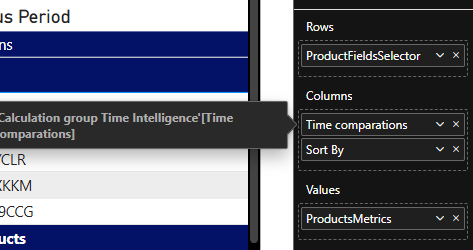 Matrix visual configuration
Part 2 - Time Comparisons - REF #2
For the time comparisons, we create a calculation group that will compare the Profit amount for the current period to the previous period.
-
Create a new calculation group
-
In Calculation items create the measures you need to compare the selected period vs the previous period. In my case, it looks like this:
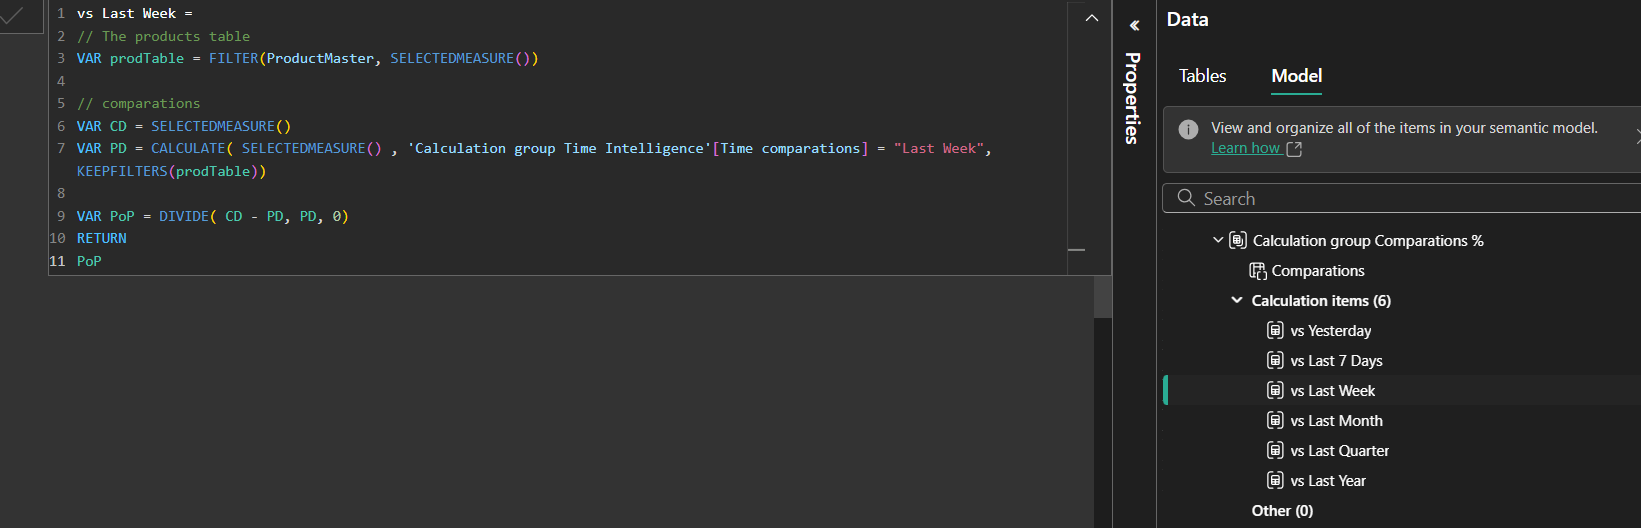 Time comparison calculation items
This measure for example, compares This week vs Last week, my measure for the last week looks like this:
Last Week = CALCULATE ( SELECTEDMEASURE (), 'Calendar'[NaturalWeekNumId] = -1 )
Important note: I used the variable prodTable to filter the table to include only the products that have profit to use in the CALCULATE as a KEEPFILTERS(prodTable) to optimize the performance; by doing it like this, the engine will not scan all the products but only the products that are affected by the Profit measure.
- In a new matrix, place the Profit amount measure in the matrix as Rows, the calculation group in the matrix columns, and in a slicer too.
Part 3 - Top/Bottom N Analysis - REF #3
For the Top/Bottom N we create a calculation group that will compare the Profit amount for the current vs previous period.
-
Create a new calculation group
-
In Calculation items create 2 items. I am using TOPN() function because in my case it performs way better than RANKX():
Top N =
VAR N = RankingRange[RankingRange Value]
VAR prodTable =
    FILTER (
        ALL ( ProductMaster ),
        SELECTEDMEASURE ()
    )
VAR ranking =
    TOPN (
        N,
        prodTable,
        SELECTEDMEASURE (),
        DESC
    )
VAR result =
    CALCULATE (
        SELECTEDMEASURE (),
        KEEPFILTERS ( ranking )
    )
RETURN
    result
Bottom N =
VAR N = RankingRange[RankingRange Value]
VAR prodTable =
    FILTER (
        ALL ( ProductMaster ),
        SELECTEDMEASURE ()
    )
VAR ranking =
    TOPN (
        N,
        prodTable,
        SELECTEDMEASURE (),
        ASC
    )
VAR result =
    CALCULATE (
        SELECTEDMEASURE (),
        KEEPFILTERS ( ranking )
    )
RETURN
    result
- Place the calculation group in a slicer; it will automatically filter the measure.
Conclusion
Congratulations! You’ve built the ultimate Power BI Time Comparisons Top N Analysis page with top-notch performance. This approach allows stakeholders to analyze data faster while enjoying advanced filtering and time comparison features.
Key benefits of this approach:
- Superior performance: Using TOPN() instead of RANKX() for better query execution
- Flexible time comparisons: Easy switching between different time periods
- Dynamic N parameter: Users can adjust the number of top/bottom items on the fly
- Calculation groups efficiency: Reduces measure proliferation and improves maintainability
By avoiding performance-heavy functions like RANKX, IF, and SWITCH, and leveraging calculation groups with SELECTEDMEASURE(), this solution provides enterprise-grade performance for complex analytical scenarios.
Comments
Share your take or ask a question below.