Featured Content

AI Agent Skills: Stop Paying for Tokens You Don't Need
AI agent Skills replace bloated instruction files with on-demand context loading — cutting token waste by 80% for Excel and Power Query workflows.
AI Agent Skills: Stop Paying for Tokens You Don't Need
AI agent Skills replace bloated instruction files with on-demand context loading — cutting token waste by 80% for Excel and Power Query workflows.

Why Your BI Team Needs a Product Mindset, Not Just Reports
Discover why developing a BI team product mindset is essential for building compounding value. Learn how to shift from reactive reporting to strategic product thinking.

DAX and UDF SVG Charts in Power BI: Complete Guide
Learn to build DAX and UDF SVG charts in Power BI with this complete guide. Create custom visualizations using pure DAX code with dynamic scaling and conditional formatting.

DAX + UDF = the React of Power BI
Learn how to combine Power BI DAX user-defined functions with HTML visuals to build reusable KPI cards, tables, and progress bars that wow report stakeholders.

Automating Power BI Themes with Fabric, Notebooks and BIBB Theme Generator API: A Complete Guide
Learn how to automate Power BI report theme updates using Microsoft Fabric, Python, and the BIBB Theme Generator API for seamless theme management.

What is a Template in Power BI? Settling the debate.
Understand what each Power BI Template type does, when to use it, and how it shapes the user experience.

Improving BI User Experience in Corporate Environments: Practical Strategies That Work
Discover actionable techniques for improving BI user experience in corporate environments, focusing on user personas, training, and documentation.

Data Exfiltration in Power Query - Understanding the Risk and Protections
Data Exfiltration in Power Query: Understanding the Risk and Protections

Automation of the 'Meet the Team' PDF Slides with Power BI
Automate 'Meet the Team' PDF slides using Power BI, SharePoint, and Power Automate to save time, ensure consistency, and scale across proposals.

Master Power BI Time Comparisons and Top N Analysis for Optimal Performance
Learn how to perform Power BI Time Comparisons and Top N Analysis with optimal performance using calculation groups and field parameters instead of slow RANKX functions.
KPI Tree for Performance Management: A Visual 7-Step Guide

Most organisations struggle with a fundamental problem: they have ambitious strategies but no clear way to track whether they’re actually achieving them. Teams drown in reports, argue over which metrics matter, and often measure activity rather than outcomes. The result? Months of wasted effort and dashboards nobody actually uses.
There’s a better way. KPI Trees offer a visual, collaborative approach that connects your strategic objectives to day-to-day measures, making the abstract tangible and the complex simple. Having developed this methodology in 2011 and refined it through hundreds of implementations, I’ve seen first-hand how it transforms organisational performance measurement from a source of frustration into a driver of success.
What Makes KPI Trees Different
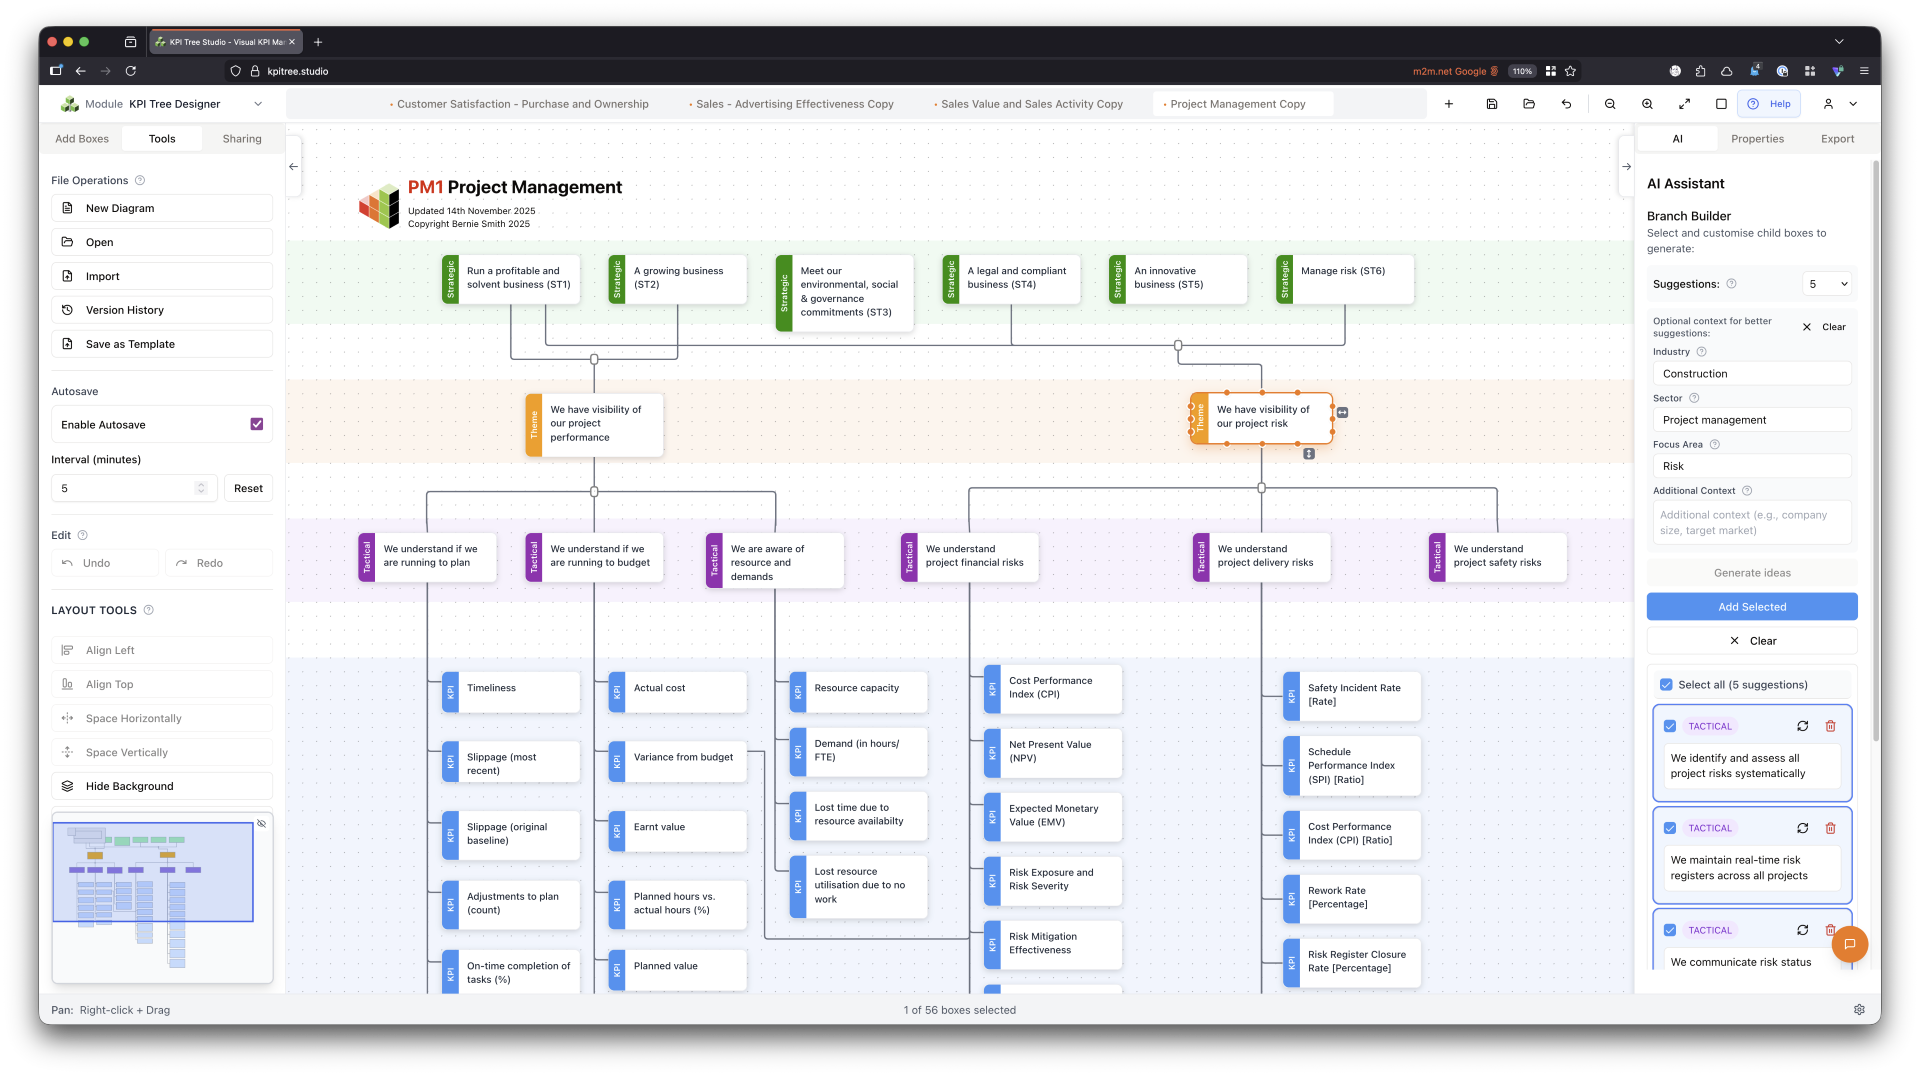 Sample KPI tree
A KPI Tree is a visual hierarchy showing how your organisation’s strategic goals break down into measurable outcomes. Think of it as a family tree for your performance measures – you can see exactly how everything connects, from board-level objectives right down to operational metrics.
Unlike traditional approaches that generate lengthy documents requiring interpretation, a well-constructed KPI Tree can be understood by anyone in your organisation within minutes. The visual nature makes gaps and inconsistencies immediately obvious. You spot missing elements, redundant measures, or logical flaws that would remain hidden in spreadsheets and text-based strategies.
The approach addresses the behavioural challenges that cause most measurement initiatives to fail. Rather than imposing metrics from above, it creates genuine ownership through collaboration.
The Psychology Behind Visual Mapping
Research from MIT’s Brain and Cognitive Sciences department, published in Attention, Perception, and Psychophysics, found that the human brain can process and identify images in as little as 13 milliseconds – far faster than the 100 milliseconds previously thought possible. To put this in perspective, reading and comprehending text requires sequential processing that takes considerably longer, typically 200-250 milliseconds per word for skilled readers.
This dramatic difference in processing speed explains why visual tools are so powerful for understanding complex relationships. When applied to performance measurement, this means:
- Reduced cognitive load: Complex relationships become instantly apparent
- Improved retention: Visual structures are remembered more easily than lists
- Enhanced collaboration: Teams can literally point to areas of agreement or concern
- Faster decision-making: Problems and opportunities become visible at a glance
As Professor Mary Potter from MIT notes, “The fact that you can do that at these high speeds indicates to us that what vision does is find concepts. That’s what the brain is doing all day long — trying to understand what we’re looking at.”
Building Your First KPI Tree for Performance Management: The Seven-Step Process
Creating an effective KPI Tree typically requires a handful of 1-hour sessions (online or face-to-face), usually totalling four to six hours of workshop time. Here’s how the structured process works:
Step 1: State Your Strategic Objectives
Start by clarifying what you’re trying to achieve. Review existing strategy documents and distil them into clear, single-phrase objectives that anyone could understand. These form your strategic level – the green boxes at the top of your tree.
Example objectives: Here are the rewritten objectives:
- Our customers resolve their issues on first contact and recommend us to others
- We generate consistent profits whilst maintaining our market position
- We possess the skills and systems to outperform our competitors
- Our people actively contribute ideas and choose to stay with us
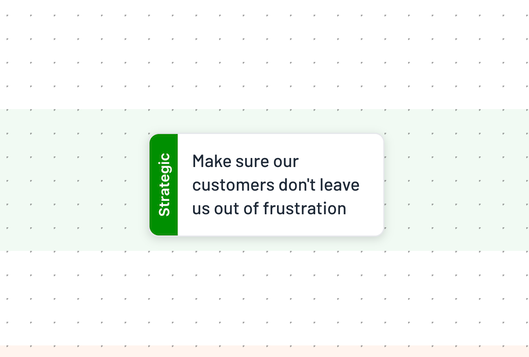 Initial Strategic Objectives
Step 2: Break Down Into Themes
Take each strategic objective and identify the key themes or drivers that influence it. For instance, if your objective is “Deliver exceptional customer experience,” your themes might include:
- We respond to customers quickly and are accessible when they need us
- We provide accurate advice from knowledgeable staff
- We resolve issues completely on first attempt
- We inform customers before they need to contact us
- Customers receive consistent service across all channels
These become your orange boxes, representing the major areas that contribute to achieving your strategic objective.
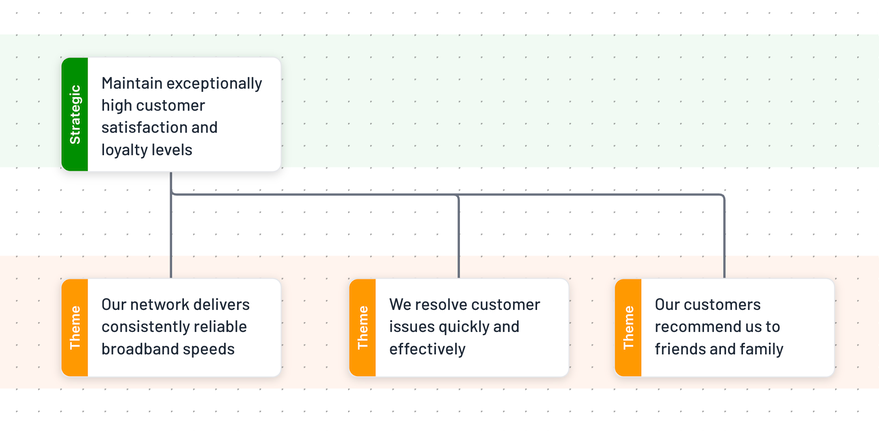 Themes Breakdown
Step 3: Refine Your Language
Vague descriptions lead to confused implementation. Use 5-10 words to describe each element precisely. This step is crucial because language drives understanding, and understanding drives behaviour.
Poor examples:
- “HR” (department name, not an outcome)
- “World-class service” (meaningless buzzword)
- “Improve efficiency” (too vague)
Better examples:
- “We recruit appropriately skilled people”
- “Customers receive accurate first-time responses”
- “We reduce process cycle times”
Step 4: Check for Common Pitfalls
Watch for these typical mistakes that derail measurement initiatives:
- Including targets prematurely: Numbers invoke strong emotions and derail discussions about what to measure
- Measuring activity instead of outcomes: Counting what people do rather than what they achieve
- Using corporate buzzwords: Terms like “synergistic” or “best-in-class” that nobody can define
- Creating conflicting metrics: Measures that encourage opposing behaviours
Step 5: Show Relationships
Boxes on your KPI Tree connect to show relationships. This is where the real insight emerges:
- Grey lines indicate cause-and-effect relationships (most common)
- Red lines show conflicts where improving one measure might negatively impact another
These connections reveal hidden dynamics in your performance system. For instance, you might discover that your speed metrics conflict with quality measures, or that cost reduction targets undermine customer satisfaction goals.
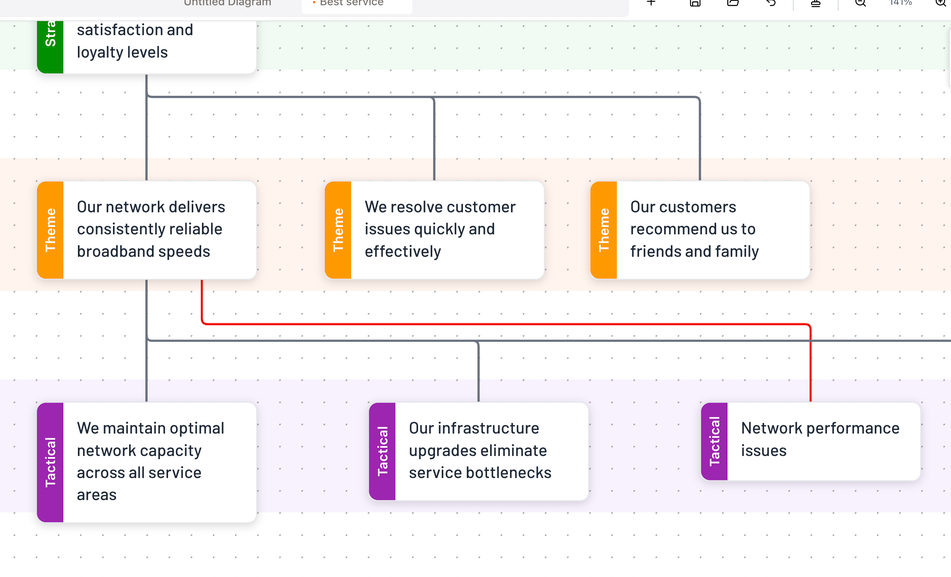 Relationships Example
Step 6: Develop Tactical Level
Repeat the breakdown process for each theme, creating tactical branches (purple boxes). By this level, you should be getting quite specific about the outcomes you’re seeking.
For the theme “Response times and accessibility”, tactical elements might include:
- Answer calls within our Service Level Agreement (SLA)
- Provide 24/7 digital channel availability
- Route queries to right expert first time
- Acknowledge written queries promptly
- Maintain consistent response standards
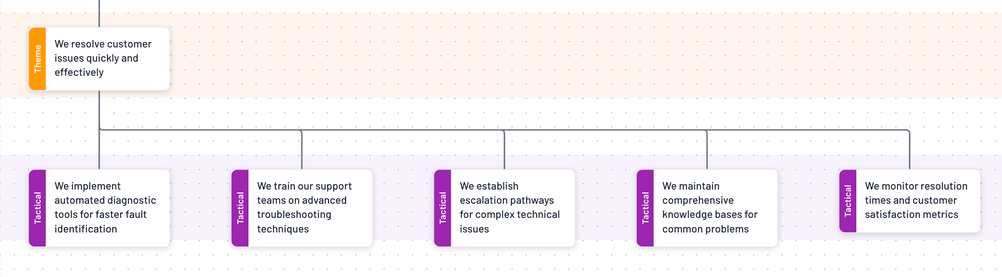 Tactical Level Example
Step 7: Identify Your Measures
At the lowest level, it becomes straightforward to identify relevant KPIs (blue boxes). For “Answer calls within target time,” you might measure:
- Average speed to answer (seconds)
- Percentage of calls answered within 20 seconds
- Longest wait time experienced
- Call abandonment rate
- First call resolution percentage
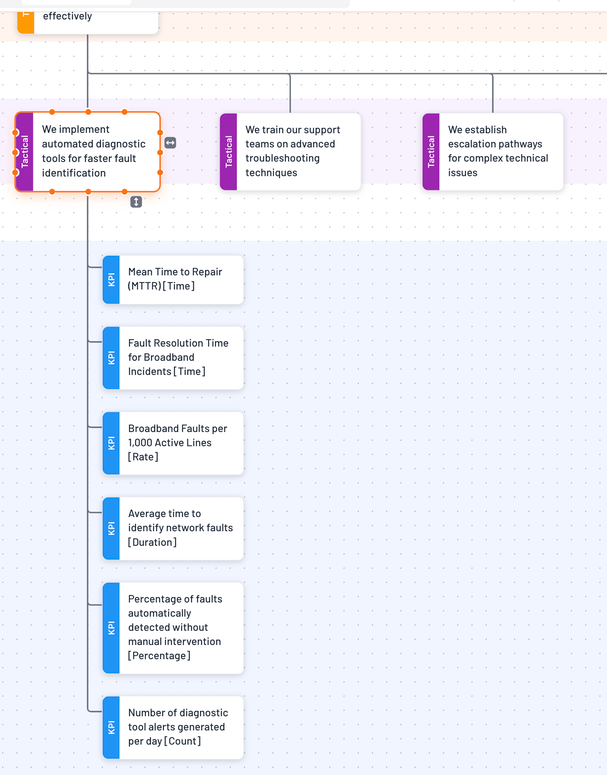 Measures Example
Real-World Implementation: Case Studies
Case Study 1: Global Manufacturing Company
A multinational manufacturer with £3 billion revenue was struggling with inconsistent performance measurement across sites. Different locations measured productivity differently, making comparison impossible and leading to poor investment decisions.
The challenge: The company nearly closed their most efficient plant because inconsistent KPI definitions made it appear underperforming.
The solution: Through KPI Tree workshops involving operations managers from all sites, we developed a unified measurement framework. The visual mapping revealed that sites were measuring different stages of the production process, explaining the apparent performance gaps.
The result:
- 43% reduction in reporting effort
- Consistent metrics enabling proper benchmarking
- £12 million saved by avoiding closure of the “underperforming” plant (that wasn’t at all underperformaing, but this was hidden by inconsistent metrics between sites)
- Clear identification of genuine improvement opportunities
Case Study 2: Retail Banking Division
A major bank’s retail division was drowning in metrics – their monthly performance pack contained 347 different measures, yet executives still felt blind to actual performance.
The challenge: Information overload paralysing decision-making, with teams gaming metrics that conflicted with each other.
The solution: KPI Tree workshops with divisional heads mapped all existing metrics to strategic objectives. This revealed that 70% of measures weren’t linked to any strategic goal, whilst critical areas had no metrics at all.
The result:
- Reduced to 23 core KPIs with clear strategic alignment
- 60% reduction in time spent on reporting
- Improved employee engagement as teams understood how their work contributed to success
- 15% improvement in customer satisfaction within six months
The Power of Visual KPI Mapping in Practice
Consider how visual mapping transforms understanding. When stakeholders can literally see the connections between their daily work and strategic objectives, several things happen:
Enhanced Strategic Alignment
Teams stop working in silos when they understand how their metrics connect to others. A procurement team seeing their cost metrics linked to quality outcomes thinks differently about supplier selection. Sales teams understanding the connection to customer lifetime value pursue different opportunities.
Conflict Resolution Through Transparency
Hidden conflicts between metrics cause enormous organisational friction. Visual mapping makes these tensions explicit, enabling constructive discussion rather than finger-pointing. When everyone can see that speed and quality metrics conflict, they can work together to find the right balance rather than blame each other for poor performance.
Rapid Identification of Gaps
Missing branches on your tree indicate strategic blind spots. One financial services client discovered they had no metrics for innovation despite it being a strategic priority. The visual gap was impossible to ignore, leading to immediate action.
Managing the Measurement Explosion
One challenge with KPI Trees is that they generate extensive lists of potential measures – often 70 or more candidates from a single strategic objective. This is actually a strength, not a weakness. The comprehensive mapping ensures nothing important gets missed, but you certainly won’t implement every measure identified.
The Shortlisting Process
Systematic evaluation reduces your longlist to a focused set. For each candidate measure, assess:
Importance factors:
- Strategic impact (how much does this affect our objectives?)
- Risk indication (does this warn us of problems?)
- Decision relevance (will this change what we do?)
- Stakeholder value (who needs this information?)
Practicality factors:
- Data availability (can we get reliable data?)
- Collection cost (what’s the effort versus value?)
- Timeliness (can we get data when needed?)
- Accuracy (will the data be trustworthy?)
By scoring then ranking each KPI on the two dimensions of ‘Importance’ and ‘Ease of measurement’ you can quickly reduce your longlist to 15-20 KPIs that genuinely drive performance whilst remaining manageable.
Tools and Technology Considerations
Whilst KPI Trees can be drawn using basic tools like PowerPoint or even Excel, specialist software can significantly accelerate the process and improve output quality. When selecting tools, consider:
Basic Requirements
- Ability to create hierarchical diagrams
- Support for relationship mapping
- Collaborative editing capabilities
- Export options for sharing
Advanced Capabilities
- Metadata attachment to measures
- AI support in wording and ‘chunking’ (breaking down objectives into smaller outcomes)
- Version control and change tracking
- Integration with reporting systems
- Template libraries for common objectives
- Automated consistency checking
Tool Categories
Simple diagramming tools (PowerPoint, Visio, Miro) work for initial exploration but become unwieldy for complex trees or multiple versions.
Mind-mapping software (MindManager, XMind) handles hierarchy well but often struggles with cross-connections and metadata.
Specialised KPI Tree software (KPI Tree Studio) provides purpose-built functionality including measure libraries, automated shortlisting, and direct integration with reporting platforms.
Beyond the Tree: Implementation Success Factors
Building your KPI Tree is just the beginning. The real value comes from embedding it into organisational practice.
Clear Ownership and Accountability
Each measure needs a responsible owner who understands:
- What’s being measured and why
- How the data is collected and validated
- What good performance looks like
- Which actions improve the metric
- How their measure affects others
Regular Review and Evolution
Strategy evolves, and your KPI Tree should too. Schedule quarterly reviews to:
- Check measures remain strategically relevant
- Identify new branches needed for emerging priorities
- Remove obsolete metrics
- Adjust relationships based on observed patterns
- Refine definitions based on practical experience
Communication and Engagement
Use your KPI Tree as a living communication tool:
- Display trees prominently in offices and online
- Reference them in performance discussions
- Use them for onboarding new team members
- Create simplified versions for different audiences
- Celebrate when branches turn from red to green
Balanced Perspectives
Ensure comprehensive coverage across stakeholder groups:
- Financial outcomes for shareholders
- Service metrics for customers
- Operational measures for efficiency
- Capability indicators for sustainability
- Innovation metrics for future growth
Common Implementation Challenges and Solutions
Challenge: Resistance to Another Measurement Initiative
Solution: Position KPI Trees as simplification, not addition. Show how they replace multiple conflicting sources of metrics with one coherent framework.
Challenge: Senior Stakeholders Too Busy for Workshops
Solution: Run initial sessions with delegates, then use the draft trees for focused senior review. Visual format enables quick, productive discussions.
Challenge: Technical Teams Overwhelm with Detail
Solution: Set clear level boundaries. Technical measures belong in operational dashboards, not strategic KPI Trees. If you can’t explain it to the board, it’s too detailed.
Challenge: Fear of Transparency
Solution: Start with positive framing. Poor metrics indicate improvement opportunities, not failure. Use the tree to show how external factors affect performance.
Making KPI Trees Work in Your Organisation
The beauty of this approach lies in its flexibility. Whether you’re running a division of a multinational corporation or leading a growing business, the fundamental process remains the same.
Getting Started: A Practical Approach
- Pick a focused pilot: Choose one strategic objective causing confusion or debate
- Assemble a diverse team: Include strategy owners, subject experts, and data analysts
- Run initial workshops: Use the seven-step process to build your first tree
- Test with stakeholders: Share the draft tree widely, gathering feedback
- Refine and finalise: Incorporate insights and identify quick wins
- Expand gradually: Build confidence before tackling all objectives
Investment and Returns
The typical investment – four to six hours of workshop time plus preparation – pays back through:
- Avoided effort on unused metrics
- Faster decision-making from clear information
- Reduced conflict from aligned measures
- Improved performance from focused attention
- Better resource allocation from visible priorities
Remember: KPI Trees don’t solve problems for you, but they do shine a light on problems so you can take action. They transform abstract strategy into concrete measures, creating the foundation for evidence-based management and continuous improvement.
Conclusion: From Confusion to Clarity
KPI Trees represent more than just another management tool. They provide a visual language for discussing performance that transcends departmental boundaries and hierarchical levels. By making the implicit explicit and the complex simple, they enable organisations to move from arguing about metrics to improving performance.
The methodology has now been proven across hundreds of implementations spanning every major industry. The consistent lesson: when people can see how their work connects to strategic success, they make better decisions, feel more engaged, and deliver superior results.
Start small, think visually, and let the structure guide you towards the measures that truly matter.
For organisations ready to accelerate their KPI Tree development, kpitree.studio is now available to streamline the creation process, maintain version control, and integrate with existing reporting systems. These solutions can reduce the time to build comprehensive trees from days to hours whilst ensuring consistency across multiple teams and objectives.
Comments
Share your take or ask a question below.