
Featured Content

Power Query for Excel Users — New Book
12 real workplace scenarios. Every chapter ends with a deliverable. Follow Quinn from messy exports to a working data model. Published by Packt.
Power BI SVG Measures: 7 Use Cases, 17 Rules, and an AI Prompt
Power BI SVG measures: stop breaking yours. Learn where to use them, follow 17 priority-based rules, and grab an AI prompt template for bulletproof visuals.

Connecting Clockify to Power BI: Three Integration Patterns That Work
Connect Clockify to Power BI three ways: hand-rolled Web.Contents calls, the free custom connector, or a ready-made template. Pick by build versus ship.
bibb Analytics: Designing Measurement Like a BI Problem
The same framework we apply to client BI work applies here: goals first, layers second. Here is the strategy behind bibb.pro's analytics.
bibb Analytics Build in Public: Introduction
bibb.pro had GA4 running since day one. Events were firing. Data was collecting. But without a strategy, that is noise with a database attached. This series documents fixing that.
Git for Power BI and Fabric Users: A Beginner's Guide
Power BI and Fabric development is moving toward programmatic workflows. Here is what Git is, how to install it on Windows, and how to use it as a BI or Fabric developer.
6 Power BI Modern Button Slicer UI Patterns for Better Dashboards
Learn 6 Power BI Button Slicer UI patterns to build modern dashboards: segmented controls, tabs, KPI cards, toggle buttons, and more.
Salesforce Power BI Integration: A Practical Comparison Guide
Salesforce Power BI integration done right: compare native connectors, custom API, and the Metrica connector to choose the best approach for your team.

How to Design Better KPIs Before They Mislead You
How to design better KPIs starts with knowing what your formula isn't measuring. A real BI case study in dashboard blind spots, with DAX examples and a fix.

AI Agent Skills: Stop Paying for Tokens You Don't Need
AI agent Skills replace bloated instruction files with on-demand context loading — cutting token waste by 80% for Excel and Power Query workflows.
KPI Tree for Performance Management: A Visual 7-Step Guide
KPI Tree for Performance Management: a practical 7-step method to align strategy with KPIs, cut metric overload, and create dashboards people actually use.
Building Claude Dashboards on Microsoft Fabric with Fabric IQ MCP

The short version
You can build a Claude Dashboard on a Microsoft Fabric semantic model today, but it is a snapshot, not a live feed. Claude runs DAX queries against your model through the Fabric IQ MCP server, saves the results as CSV files, and the dashboard reads those files. Refreshing means asking Claude to pull the numbers again.
We tried several routes before landing here. This post covers the one that worked, the quirks we hit on the way, and the routes that did not pan out. The test data was the AdventureWorks sample model: 32 orders, $708,690 in sales, 142 products. To start straight away, skip to Step three right after the setup.
What you need
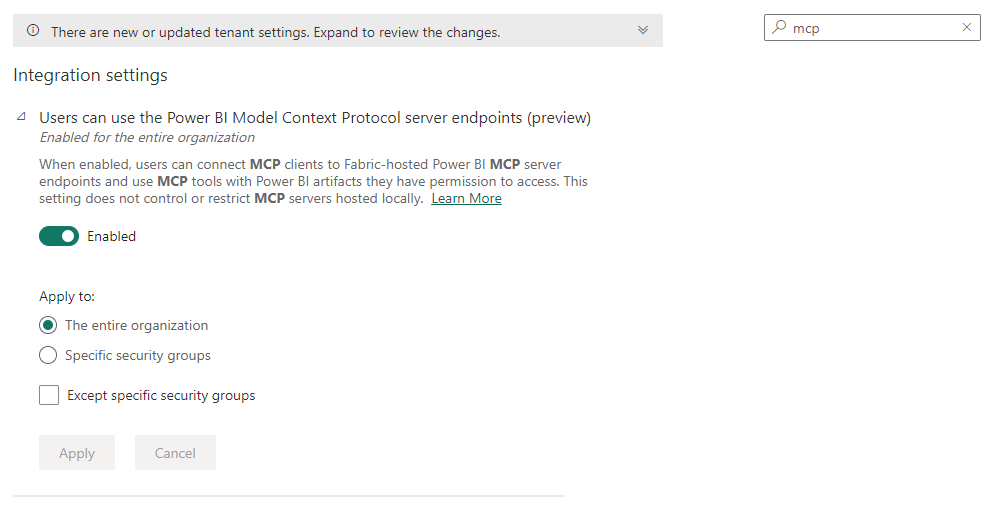
- The Power BI Model Context Protocol server endpoints setting enabled in the Fabric admin portal, under Tenant settings > Integration settings > Users can use the Power BI Model Context Protocol server endpoints (preview). A Fabric admin has to turn this on, for the whole organisation or for specific security groups, before any MCP client can reach Fabric-hosted Power BI MCP endpoints.
- A Fabric workspace with a published semantic model that your Microsoft account can read.
- Permission to register an application in Azure (Microsoft Entra ID), or someone who can do it for you.
- Two custom connectors in Claude, one for the Fabric MCP server and one for the Fabric IQ MCP server. Each needs only an MCP URL and the application’s client ID.
- A tenant region where Fabric IQ is offered. It is not available in Power BI-only regions or sovereign clouds.
- A Claude Dashboard artifact to receive the data.
Step 1: Create an Azure application
Step 1: Create an Azure application
Claude cannot sign in to Fabric on its own. You give it a sign-in by registering one application in Azure, then pointing two custom connectors at that application. Nothing else is needed: no secret, no service principal and no gateway.
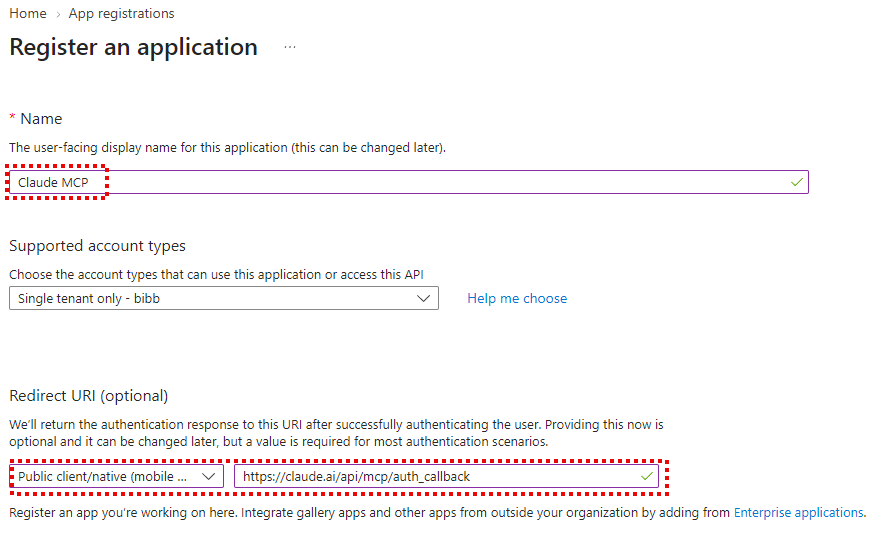
In the Azure portal, go to Microsoft Entra ID > App registrations and create a new registration. Then set up two things.
- A redirect URI. Under Authentication, add a platform of type Mobile and desktop applications and set the redirect URI to
https://claude.ai/api/mcp/auth_callback. This is what lets Claude receive the sign-in result, and it makes the app a public client, which is why there is no client secret.
- API permissions.
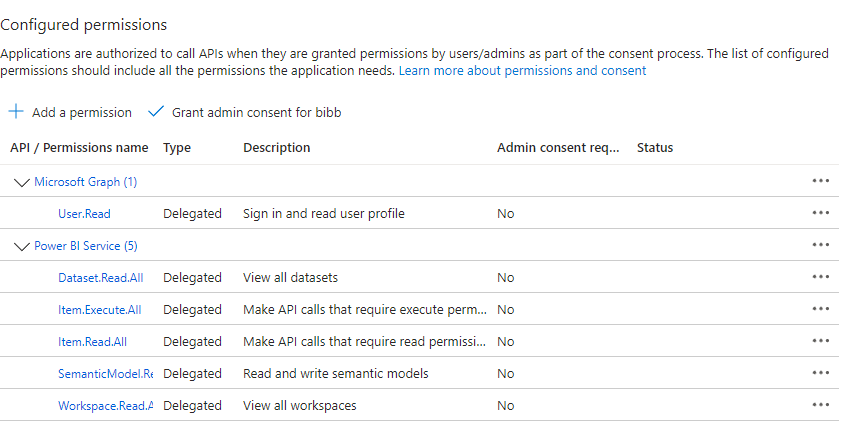
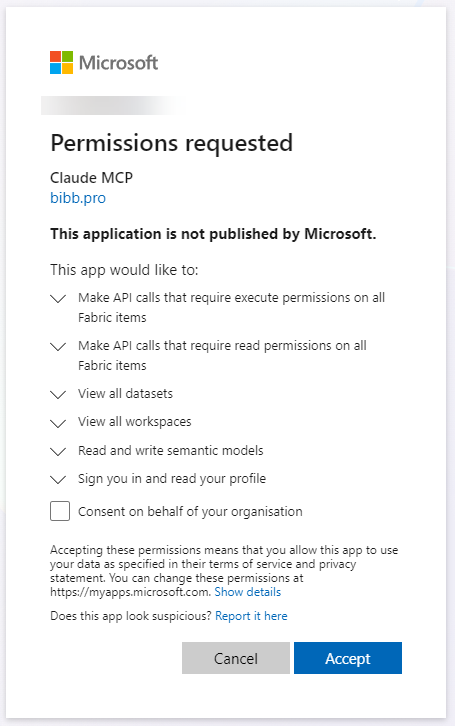
User.Read(Microsoft Graph) is there by default. Under API permissions, choose Add a permission, then Power BI Service, then Delegated permissions, and search for and add each of these permissions. None of them required admin consent in our tenant.
| API | Permission | What it allows |
|---|---|---|
| Microsoft Graph | User.Read | Sign in and read the user profile |
| Power BI Service | Dataset.Read.All | View all datasets |
| Power BI Service | Item.Read.All | Read Fabric items |
| Power BI Service | Item.Execute.All | Make API calls that require execute permission on Fabric items |
| Power BI Service | SemanticModel.ReadWrite.All | Read and write semantic models |
| Power BI Service | Workspace.Read.All | View all workspaces |
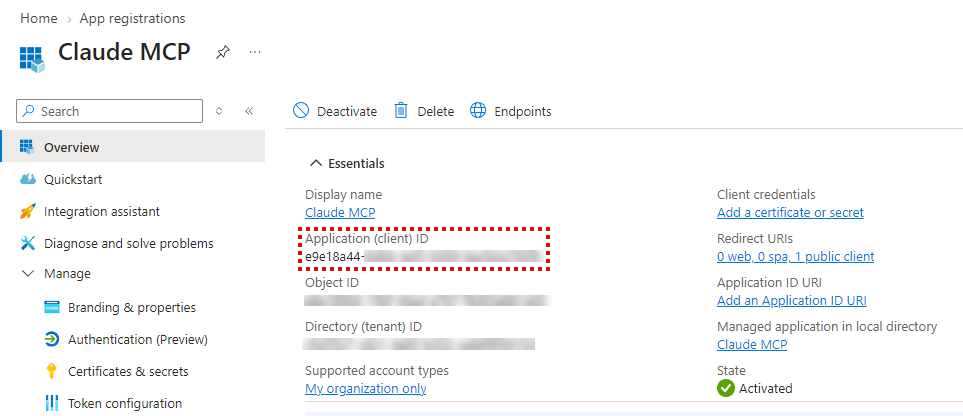
- Copy the Application (client) ID from the app’s overview page. You will paste it into both connectors.
Step 2: Connect Claude to Fabric
Step 2: Connect Claude to Fabric
You add each Microsoft Fabric MCP server to Claude as a custom connector. Do the steps below twice, once for each MCP server, using the same client ID from Step 1 both times.
| Connector name | MCP server URL |
|---|---|
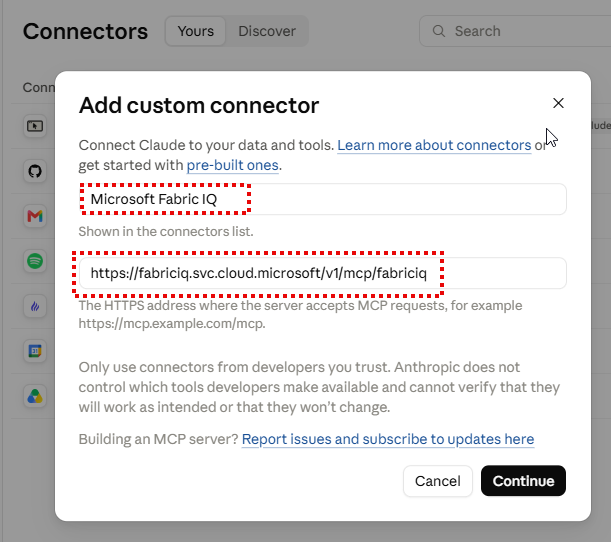
| Microsoft Fabric IQ | https://fabriciq.svc.cloud.microsoft/v1/mcp/fabriciq |
| Microsoft Fabric | https://api.fabric.microsoft.com/v1/mcp/core |
If your tenant uses private links, the Fabric IQ URL is https://api.fabric.microsoft.com/v1/mcp/fabriciq.
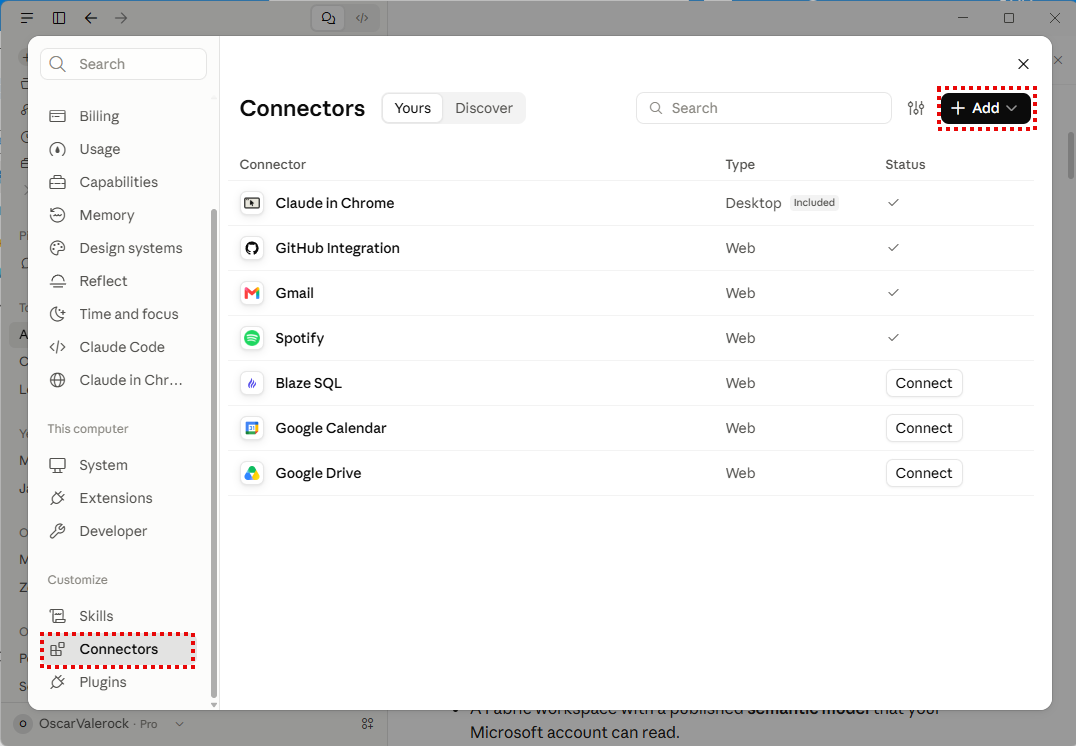
- Go to Settings, then Connectors. Choose the + Add button.
- Choose Add custom connector, enter a Name (only a label in your connectors list) and the MCP server URL from the table, then choose Continue.
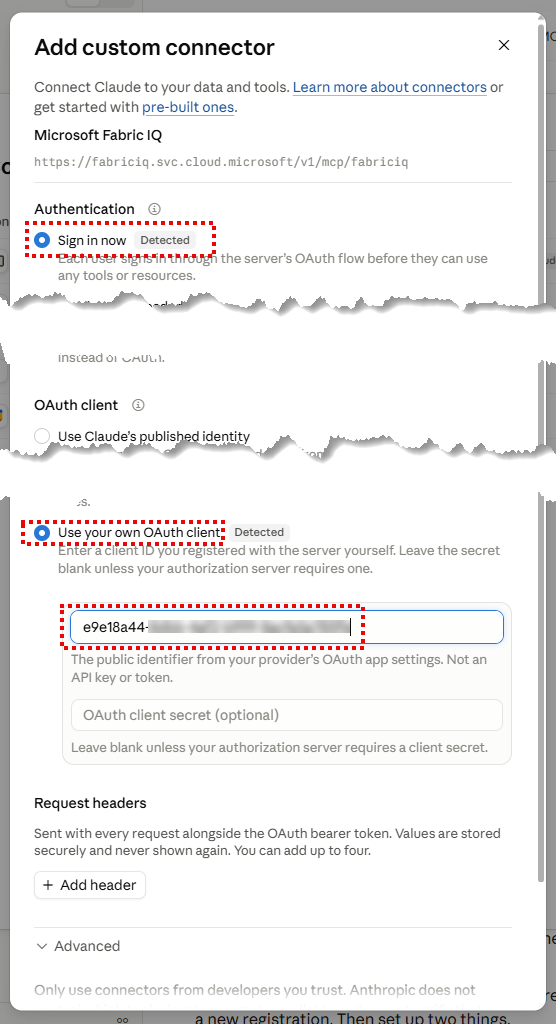
- Claude contacts the server and detects that it uses OAuth, so each user will sign in through the server’s OAuth flow before any tool is used. Under Authentication, leave Sign in now selected. Under OAuth client, choose Use your own OAuth client (Claude detects this too) and paste the Application (client) ID you copied in Step 1. Leave the client secret blank, since the permissions are delegated and the app is a public client. Leave Request headers empty and choose Add.
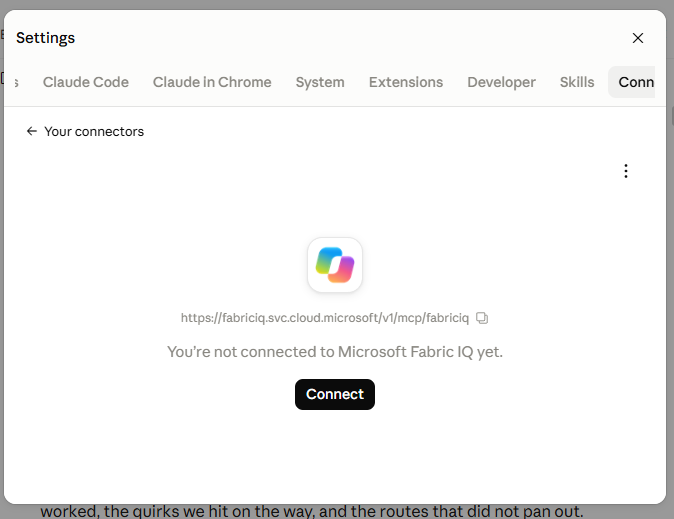
- Click Connect.
- This takes you to the Microsoft permissions screen. Review the requested permissions and choose Accept.
- If you have not already, repeat steps 1 to 5 for the other MCP server. You need both connectors connected: Microsoft Fabric IQ and Microsoft Fabric.
After you connect
From then on, Claude acts as you, so you can only reach what that account can reach, and row-level and object-level security on the model still apply.
The two servers do different jobs.
- Fabric MCP manages items: list workspaces, list items, read an item’s metadata. It has no tool for querying data.
- Fabric IQ MCP queries data. Its tools are
DiscoverArtifacts,ResolveFabricItem,GetSemanticModelSchema,ValueSearch,GetReportMetadataandExecuteQuery, which runs DAX.
With both connected, Claude can find your workspace and model, query it, and build the dashboard from the results, which is what the rest of this post covers.
Step 3: Getting started with Claude Dashboards on Microsoft Fabric
Step 3: Getting started with Claude Dashboards on Microsoft Fabric
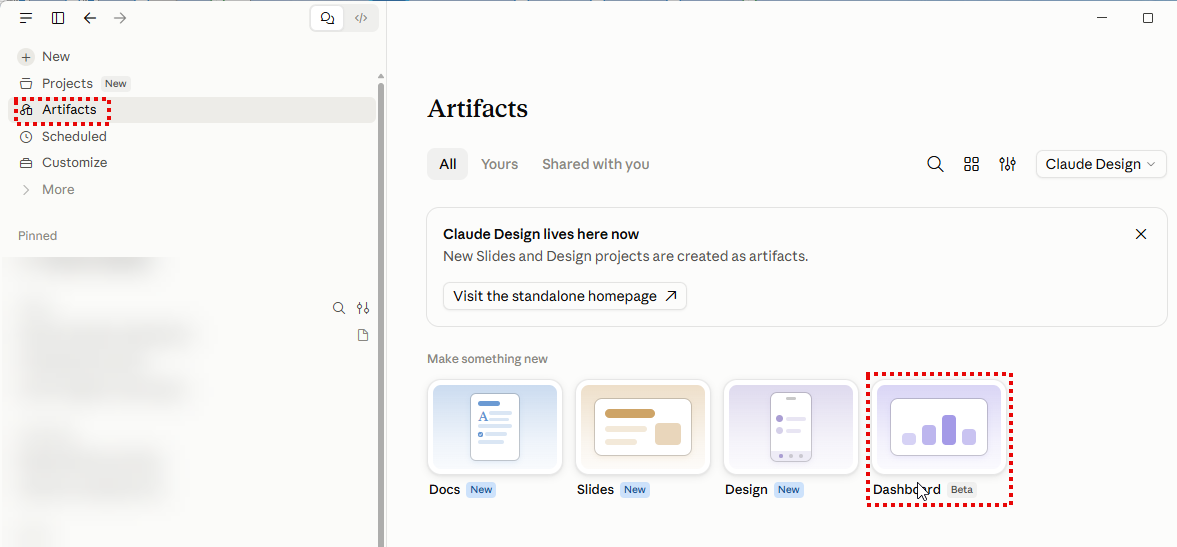
Start a new Claude Dashboard artifact. Go to Artifacts in the sidebar, then choose Dashboard (Beta) from Make something new.
Most of our time went on working out how these servers behave. Paste the block below at the start of a chat, or into a project’s instructions, so Claude can skip that discovery. Replace the placeholders in angle brackets.
I want a Claude Dashboard built from a Microsoft Fabric semantic model.

Workspace: <workspace name or id>
Semantic model: <model name or id>   (or a report ID; it resolves to its model)
Goal: <the questions the dashboard should answer, or "your call">

Optional (leave blank and Claude will ask):
Date role: <which date to use, e.g. order vs ship date; any inactive relationships to use>
Personal data: <e.g. company names only, no personal fields>
Period: <full history, or a range / as-of date>
Currency/units: <if the model mixes them>

How to get the data
- Use the Fabric IQ MCP connector to query the model with DAX. Use the Fabric MCP connector only to find the workspace and model. Don't try the Fabric REST API, Power BI endpoints or login.microsoftonline.com from the sandbox; they are blocked.
- Find the model with DiscoverArtifacts or ResolveFabricItem.
- Schema: EVALUATE COLUMNSTATISTICS(). Measures: EVALUATE INFO.MEASURES(), selecting Name and Expression. Read the definitions and note caveats (cost basis, time intelligence on partial years, which relationship a measure uses).
- COLUMNSTATISTICS shows sample values for every column. Don't query or show personal fields (names, emails, phones, credentials) unless I ask.
- Check every table you plan to use with a multi-row query. A table that returns nothing gets no error. Leave it out and say so on the page.
- Profile before designing: fact row counts, date range, rows per period. Pick the time grain from that.
- Prefer the model's own measures so numbers match existing reports. Aggregate in DAX. Max 4 queries per call. Pass maxRows when a result can exceed 250 rows.

Known quirks of the Fabric IQ connector
- Make every result multi-row. A single-row result comes back as a citation card even when padded, so put totals in long format: UNION(ROW("metric","x","value",…), …).
- Add ADDCOLUMNS(…, "pad", REPT("x", 4000)) so the result comes back as a CSV, not a citation card. Large results are saved to a JSON file: an array of {type, text} items. The CSV is the text that starts with "[Resource from … ]". Parse it with a script and never retype numbers.
- Add a constant tag column to each query ("q", "<dataset id>") and match results by tag, not position. A failed query returns nothing and no error, so the order shifts. Drop the pad and q columns before saving.
- Alias columns with SELECTCOLUMNS. Otherwise headers come back as "Table Column".
- Wrap amounts as ROUND(<measure>, 2) * 1.0, but the parser must still strip a leading apostrophe, "$" and thousands separators. Some measures keep their currency format anyway.
- Don't put FORMAT() or other never-blank expressions in SUMMARIZECOLUMNS; it cross-joins. Use ADDCOLUMNS(SUMMARIZE(…)) or format dates in the parser.
- The dashboard can't query Fabric IQ live. Its rows arrive as an attached resource, and the page receives only the citation. Use file datasets.

Building the dashboard
- Save each result as a CSV and upload each CSV in its own call. Mixed batches are refused.
- Register each as a file dataset. Put its DAX in the dataset description so a refresh re-runs exactly the same query. Then write the page so marks bind to the datasets.
- Before building, reconcile the tables: every breakdown sums to the headline total, counts match across tables, and levels of detail agree (header vs line, fact vs dimension). Put a reconciliation table on the page and show gaps rather than hiding them.
- Add an "About these figures" note: snapshot date, model and workspace, measure caveats, and anything missing and why.
- This is a snapshot. When I say "refresh", re-run the saved queries, compare with the current data, and replace only the datasets that changed. Update every dataset's refresh time.

Before you start, tell me which tables and measures you plan to use, and ask about anything unclear, including any optional field I left blank.
If your model uses different table or measure names, say so in the first block and Claude will adapt the queries.
The finished Claude Dashboard
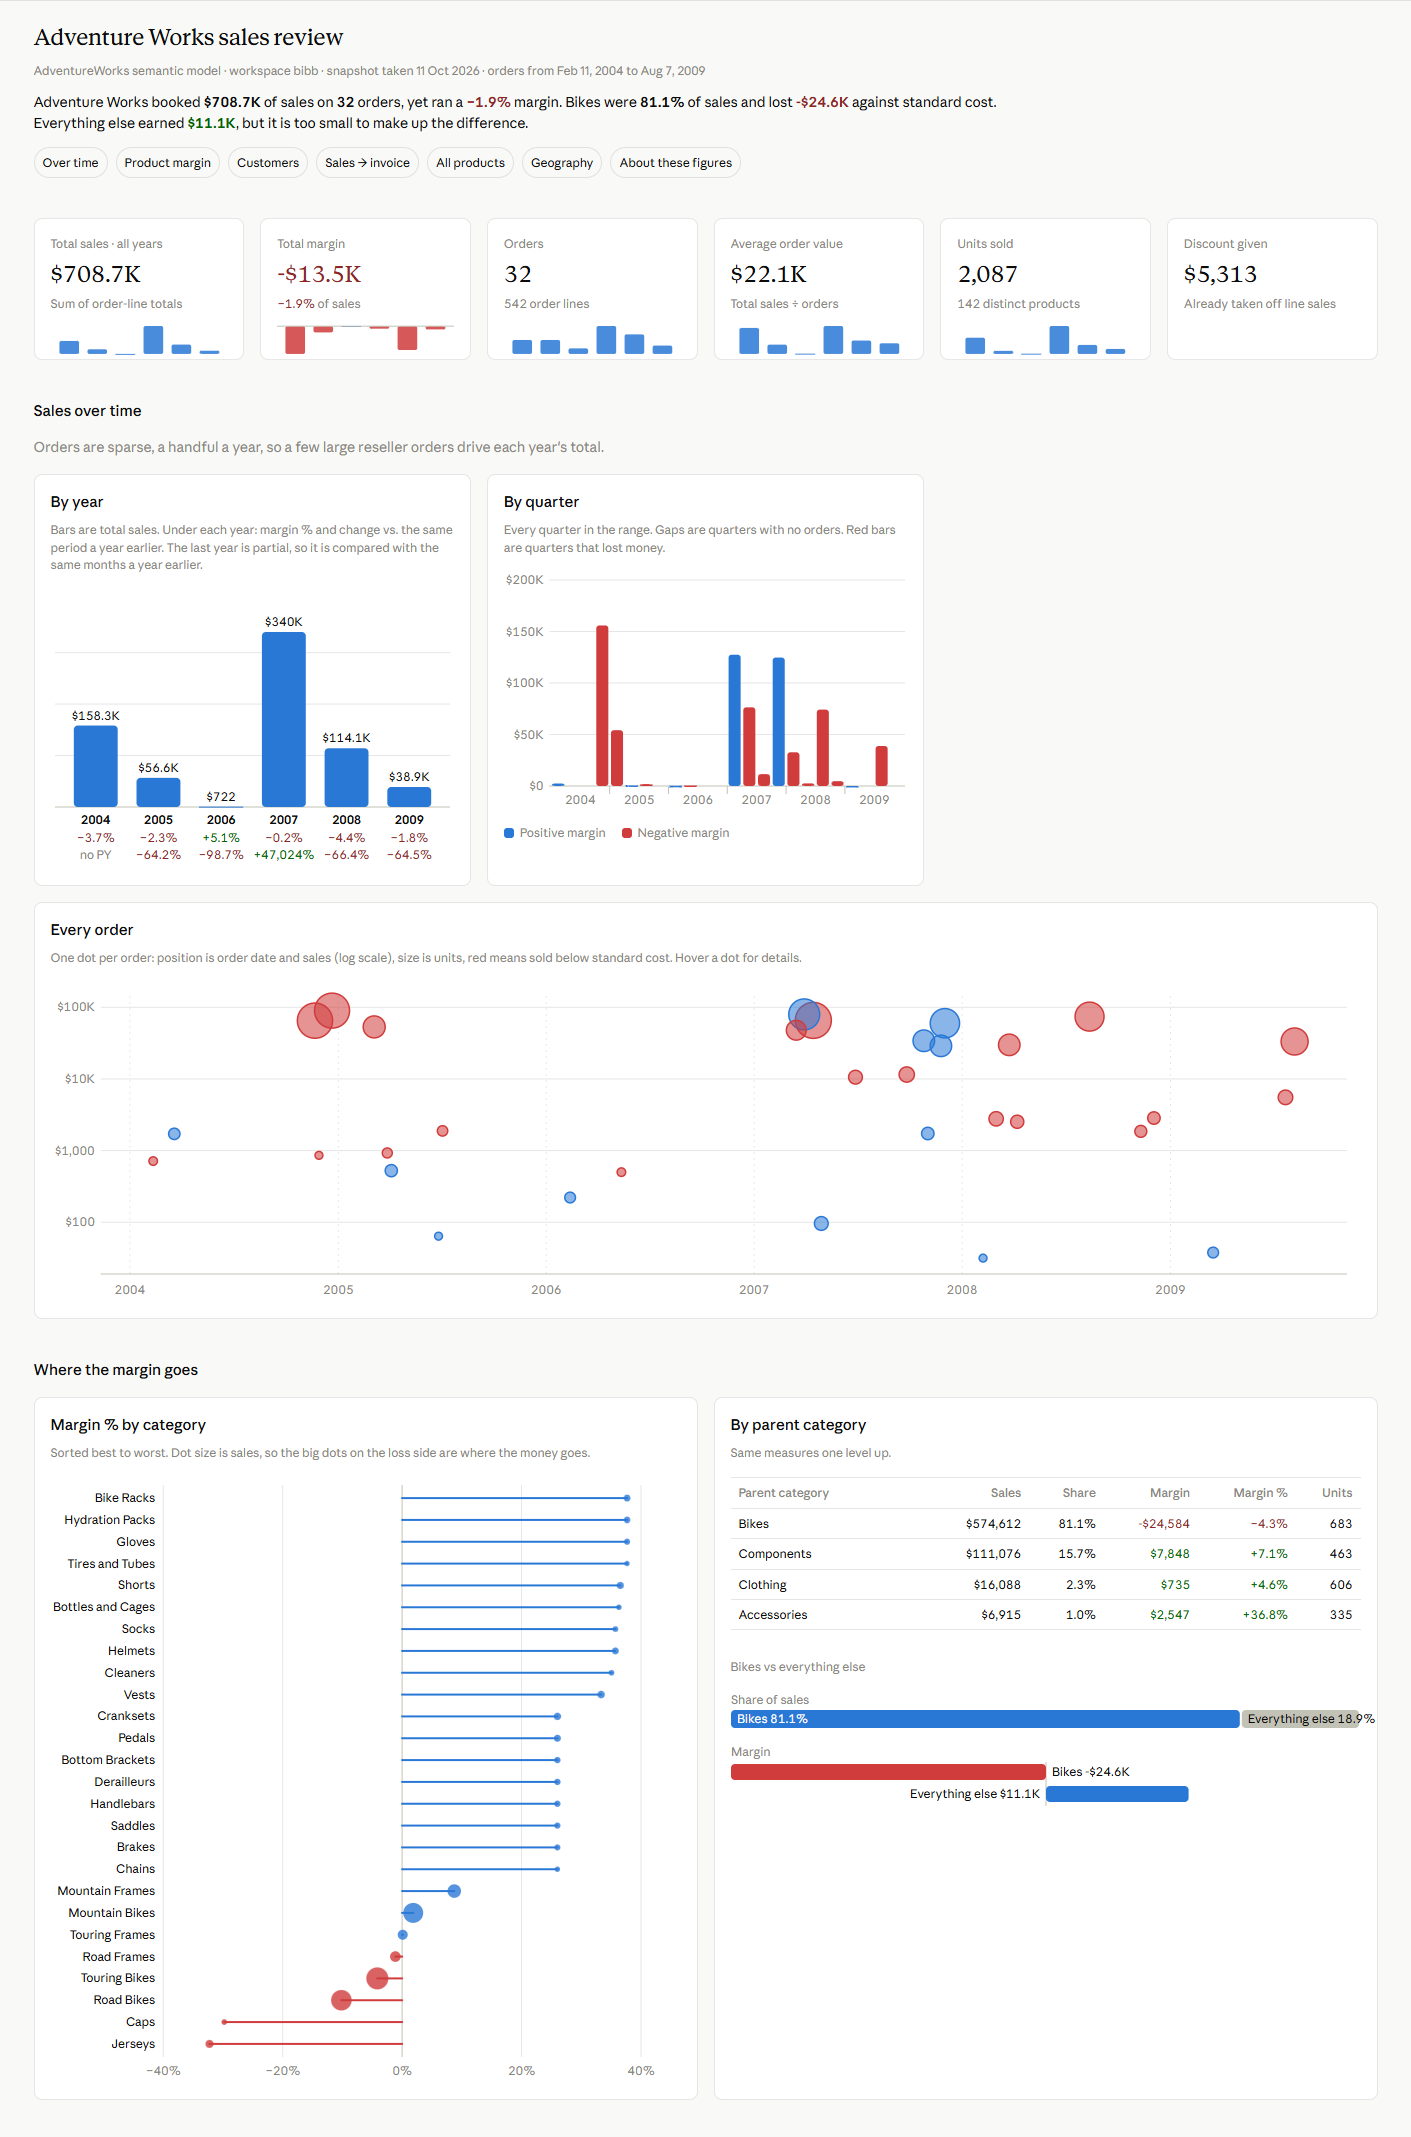
Here is the Claude Dashboard built from that AdventureWorks model: KPI tiles, sales over time by year and quarter, a per-order bubble chart, and a margin breakdown by category, all built from the CSV snapshots pulled through Fabric IQ MCP.
Challenges - Live data
Refreshing is not a live reconnect, it is Claude re-running the same DAX queries. We asked it to refresh and it checked all seven tables against the model: everything came back identical, $708,690 in sales, 32 orders, 142 products, so it kept the existing CSV files and only updated each dataset’s refresh time. Address was still unreadable, so Geography stayed left out, and the snapshot date on the page stayed correct because nothing had actually changed.
That is the catch worth being explicit about: the Claude Dashboard is not live. It reads seven saved CSV files, so the numbers only change when you ask Claude to refresh them, and anyone who opens the page sees those saved figures, even if they have no access to the underlying model themselves.
It could probably be made live instead. A dashboard source can be a query that each viewer’s own page runs through their own connector, so a source could call the Fabric IQ MCP ExecuteQuery tool with the same DAX. The numbers would then come straight from the model every time someone opens the page, scoped to that viewer’s own access rather than the snapshot’s. We have not tried this, and it carries its own risks.

Comments
Share your take or ask a question below.